- English Hindi combined.
- Laminated and fitted with plastic rollers.
| Part No. | Type | Size (cm) |
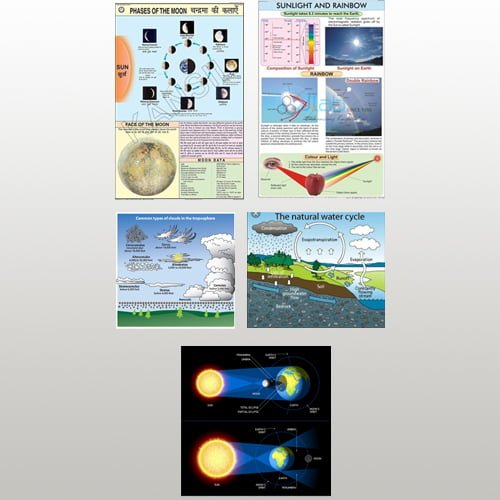
| 9860-A | Phases Of Moon | 50 x 75 |
| 9860-B | Solar & Lunar Eclipse | 50 x 75 |
| 9860-C | Seasons | 50 x 75 |
| 9860-D | Tides | 50 x 75 |
| 9860-E | Sun And Planets | 50 x 75 |
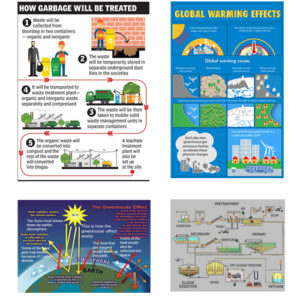
| 9860-F | Water Cycle In Nature | 50 x 75 |
| 9860-G | Directions And How To Find Them | 50 x 75 |
| 9860-H | Conventional Signs | 50 x 75 |
| 9860-I | Earth Is Round | 50 x 75 |
| 9860-J | Physical Features Of Earth | 50 x 75 |
| 9860-K | Day & night | 50 x 75 |
| 9860-L | Earthquake | 50 x 75 |
| 9860-M | Longitude & latitude (Eng. Only) | 50 x 75 |
| 9860-N | Types of clouds | 50 x 75 |
| 9860-O | Hill features, contours & map setting | 50 x 75 |
| 9860-P | Factors that affect climate | 50 x 75 |
| 9860-Q | Weather instruments (Eng. Only) | 50 x 75 |
| 9860-R | Volcano | 50 x 75 |
| 9860-S | Ocean currents | 50 x 75 |
| 9860-T | Sunlight and rainbow (Eng. Only) | 50 x 75 |
The uses of the latest geography charts in short form include:
- Data Visualization:
- Visualize complex geographic data sets to enhance understanding and facilitate analysis.
- Spatial Analysis:
- Support spatial analysis by displaying patterns, relationships, and trends in geographical data.
- Climate Change Visualization:
- Illustrate the impacts of climate change, including temperature variations and sea level rise.
- Population Distribution:
- Show population density and distribution across regions for demographic analysis.
- Land Cover and Land Use:
- Display land cover and land use changes over time for environmental monitoring.
- Remote Sensing Data Representation:
- Present data from satellite imagery and remote sensing technologies for various applications.
- Urbanization Patterns:
- Depict urban growth, infrastructure development, and spatial patterns in urban areas.
- Natural Disaster Mapping:
- Aid in mapping and monitoring areas prone to natural disasters like earthquakes, floods, and wildfires.
- Biodiversity Hotspots:
- Identify and visualize regions with high biodiversity to guide conservation efforts.
- Infrastructure Mapping:
- Map transportation networks, utilities, and other infrastructure for planning and analysis.
- Geopolitical Dynamics:
- Illustrate geopolitical boundaries, conflicts, and diplomatic relations.
- Interactive Educational Tools:
- Serve as interactive tools for educational purposes, engaging students in geography learning.